Datadog Network Monitoring First Look: Unboxing and Impressions
Introduction to Modern Network Visibility
In the contemporary digital landscape, the network is no longer just a collection of cables and routers; it is the central nervous system of the enterprise. As organizations migrate toward hybrid cloud architectures and microservices, the complexity of maintaining connectivity, performance, and security has scaled exponentially. Enter Datadog Network Monitoring, a comprehensive suite designed to provide granular visibility into every layer of network traffic. While many traditional monitoring tools focus on the hardware health of switches and routers, Datadog’s approach is integrated directly into its broader observability platform, promising a unified view of infrastructure, applications, and the network that connects them.
For IT professionals and network engineers, the "unboxing" of a software-as-a-service (SaaS) network monitoring solution is a virtual experience, yet it carries the same weight as physical hardware deployment. It involves assessing the ease of integration, the depth of initial data discovery, and the relevance of the out-of-the-box dashboards. This first look explores the Datadog Network Performance Monitoring (NPM) and Network Device Monitoring (NDM) offerings, analyzing how they handle the rigors of modern enterprise traffic and whether they live up to the high expectations set by Datadog's industry-leading application monitoring tools.
Detailed Product Analysis: Breaking Down the Layers
Datadog’s network monitoring capabilities are segmented into two primary components: Network Performance Monitoring (NPM) and Network Device Monitoring (NDM). Understanding the distinction between these two is critical for any buyer looking to solve specific visibility gaps. NPM focuses on the performance of communication between endpoints—process-to-process, container-to-container, and service-to-service. It provides a high-level view of throughput, latency, and retransmits without requiring deep packet inspection (DPI) that can often bog down system resources. Conversely, NDM focuses on the health and performance of the physical and virtual hardware that constitutes the network fabric, such as firewalls, load balancers, and switches, primarily utilizing SNMP and streaming telemetry.
The Installation and Setup Experience
The "unboxing" process begins with the Datadog Agent. For those already utilizing Datadog for server or log monitoring, enabling network monitoring is remarkably straightforward. It typically involves a minor configuration change in the datadog.yaml file or the addition of an environment variable in a containerized environment. This ease of deployment is a significant selling point; instead of deploying specialized physical probes or complex port mirroring (SPAN/TAP) configurations, the agent leverages eBPF (extended Berkeley Packet Filter) technology in Linux environments. This allows the agent to observe network traffic at the kernel level with minimal overhead, providing a sophisticated look at traffic patterns that older, agentless methods simply cannot match.
Visibility and Real-World Use Cases
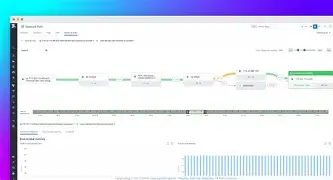
Once data begins flowing, the true power of the platform becomes evident through its Network Map. This visualization provides a real-time, interactive topology of the environment. In a real-world scenario, such as a sudden spike in latency for a customer-facing web service, an engineer can use the Network Map to see if the bottleneck resides in a specific availability zone or if a cross-region traffic surge is driving up costs and slowing down requests. Buyers typically care most about "mean time to resolution" (MTTR), and having network metrics overlaid with application traces allows for instant correlation. If a database query is slow, is it the SQL code, the server CPU, or a packet loss issue on the virtual private cloud (VPC) gateway? Datadog aims to answer this in a single pane of glass.
Another critical use case is cloud cost management. Cloud providers charge significantly for "egress" traffic—data leaving a network or moving between regions. Datadog Network Monitoring enables teams to identify "top talkers," pinpointing exactly which services or processes are responsible for high data transfer volumes. For an electronics retailer or a financial service provider, preventing "bill shock" from unoptimized inter-region traffic is just as important as maintaining uptime.
Pros and Cons of Datadog Network Monitoring
Evaluating a platform of this scale requires a balanced look at where it excels and where users might face challenges. The shift from traditional network management to cloud-native observability brings both innovations and trade-offs.
Find top-rated Electronics products at great prices.
See Deals →- Pro: Unified Observability. The single greatest advantage is the integration with the rest of the Datadog ecosystem. Seeing network metrics alongside APM (Application Performance Monitoring) and infrastructure logs eliminates the "silo" effect found in many IT organizations.
- Pro: eBPF Efficiency. By using eBPF for NPM, Datadog provides deep visibility into encrypted traffic and container communication with negligible CPU overhead, avoiding the performance penalties of older packet-sniffing technologies.
- Pro: Vendor-Agnostic Device Monitoring. NDM supports a vast array of hardware from Cisco, Juniper, Arista, and F5, making it suitable for hybrid environments that bridge on-premise data centers and the cloud.
- Pro: Autodiscovery. The platform automatically discovers network dependencies. As soon as a new microservice is deployed, the network monitor identifies its connections, reducing the manual burden on network architects.
- Con: Pricing Complexity. As with many SaaS platforms, costs can scale quickly. Because Datadog charges based on the number of monitored hosts and indexed data, high-traffic environments must be carefully managed to stay within budget.
- Con: Learning Curve. The sheer volume of data and the sophistication of the query language (Datadog's syntax) can be overwhelming for junior staff or those used to simpler "green-light/red-light" monitoring tools.
- Con: SaaS Dependency. For highly regulated industries with strict data sovereignty requirements, a pure SaaS model may require additional security scrutiny compared to an entirely on-premise appliance.
Comparison of Monitoring Methodologies
To better understand Datadog’s position in the market, it is helpful to compare its approach to other common network monitoring strategies. The following table illustrates how Datadog Network Monitoring compares to traditional SNMP-only tools and dedicated Packet Analyzers.
| Feature | Traditional SNMP Tools | Deep Packet Inspection (DPI) | Datadog Network Monitoring |
|---|---|---|---|
| Primary Metric Source | Hardware MIBs / Pollers | Packet Headers & Payloads | eBPF, SNMP, & Cloud Integration |
| Deployment Effort | Medium (Discovery required) | High (Probes & TAPs) | Low (Agent-based) |
| Cloud Visibility | Poor / Limited | Challenging in VPCs | Excellent / Native |
| Application Context | None | High (Manual Analysis) | Automatic Correlation (APM) |
| Cost Model | License per Device | High Hardware Costs | Subscription per Host/Data |
Buying Guide: Is It Right for Your Organization?
Selecting a network monitoring solution involves more than just a feature checklist; it requires an alignment with your organizational maturity and infrastructure strategy. Here are the key factors a buyer should consider when evaluating Datadog Network Monitoring.
Environment Scale and Type
If your organization is purely on-premise with static workloads, traditional SNMP-based tools might suffice. However, if you are operating in a hybrid cloud or multi-cloud environment, Datadog is specifically built for these complexities. It excels at tracking traffic across VPC peering connections, Direct Connects, and Transit Gateways—areas where traditional tools often go blind.
Team Structure and Collaboration
Does your DevOps team handle network issues, or is there a dedicated Network Operations Center (NOC)? Datadog is designed to be "developer-friendly," meaning it empowers application teams to troubleshoot their own connectivity issues without always escalating to the network team. If your goal is to break down silos and implement a Full-Stack Observability culture, this tool provides the necessary shared language.
Required Level of Detail
Buyers must decide if they need to see the "what" (performance metrics) or the "why" (actual packet contents). Datadog NPM provides the "what"—latency, throughput, and error rates. If your security team requires full packet capture (PCAP) for forensic deep-dives into raw data payloads, Datadog may need to be supplemented with a specialized security tool, though its integration with Cloud SIEM helps bridge this gap.
Budget and Scalability
Datadog’s subscription model is Opex-heavy rather than Capex-heavy. For startups and mid-market companies, this avoids large upfront hardware investments. Large enterprises, however, should conduct a thorough "Proof of Concept" (POC) to project monthly costs. Look for features like "Estimated Usage" dashboards within the platform to keep a tight rein on consumption metrics during the initial rollout phase.
Find top-rated Electronics products at great prices.
View Offers →Advanced Features: Beyond the Basics
As users move past the initial "unboxing" phase, they will discover several sophisticated features that differentiate Datadog from basic monitoring scripts. One such feature is Network Flow Monitor, which integrates VPC Flow Logs from AWS, Azure, and GCP. This allows for monitoring traffic that might not be captured by an agent, such as traffic to managed services (RDS, S3) or serverless functions like AWS Lambda.
Furthermore, DNS Monitoring is an often-overlooked but vital component. Many network "outages" are actually DNS failures—either high resolution latency or NXDOMAIN errors. Datadog automatically tracks DNS performance from the agent’s perspective, allowing engineers to see if a service degradation is caused by a failing internal DNS server or an external provider issue. This level of specific, actionable data is what buyers typically prioritize when moving away from legacy "pings and traceroutes."
Synthetics Integration
While NPM and NDM look at actual traffic, Datadog’s Synthetic Monitoring can be used in tandem to simulate user journeys from global locations. By combining these, an organization can compare "how the network is performing for real users" versus "how the network performs under simulated load." This creates a proactive defense against downtime, identifying regional ISP issues before a significant number of customers are affected.
Conclusion
Datadog Network Monitoring represents a significant shift in how enterprises approach connectivity visibility. By moving away from isolated hardware checks and toward kernel-level observability and cloud-native integration, it addresses the most pressing concerns of modern IT leaders: complexity, speed, and cross-team collaboration. The initial "unboxing" reveals a platform that is remarkably easy to start with but offers immense depth for those who wish to tune their network for peak efficiency.
While the pricing model requires a strategic approach and the platform's breadth necessitates a commitment to learning its nuances, the benefits of unified observability are hard to ignore. For any organization where the network is the backbone of their revenue—be it through e-commerce, digital services, or global logistics—Datadog provides a modern, scalable, and insightful lens into the digital traffic that keeps their business moving. As the boundaries between applications and the network continue to blur, having a tool that treats them as a single, cohesive unit is not just a luxury; it is becoming a fundamental requirement for operational excellence.